
Executive Command Centre Dashboard & Field Technician Workspace
A complete guide to every metric card, financial formula, interactive chart, date filter, quick action, and operational tab on the Keystone X Command Centre (/home/index).
1. How the Dashboard Adapts to Your Role
When you log in or click Dashboard at the top of the left sidebar, Keystone X checks your security permissions (specifically the view_reports permission in Manage Roles & RBAC) and automatically loads one of two specialized workspaces:
- Premier Executive Command Centre (Admins, Accountants, Sales & Managers): Displays company-wide financial performance, cashflow velocity, SARS VAT liability, sales funnels, workshop matrices, helpdesk SLAs, stock valuations, and live audit logs across 6 interactive tabs.
- Secure Field Technician Workspace (Technicians & Non-Financial Staff): Automatically hides sensitive company bank balances, turnover, profit margins, and tax figures. Instead, it presents a focused daily workload dashboard showing only the jobs, support tickets, and tasks assigned to that specific technician.
2. Top Header Controls, Quick Actions & Date Filtering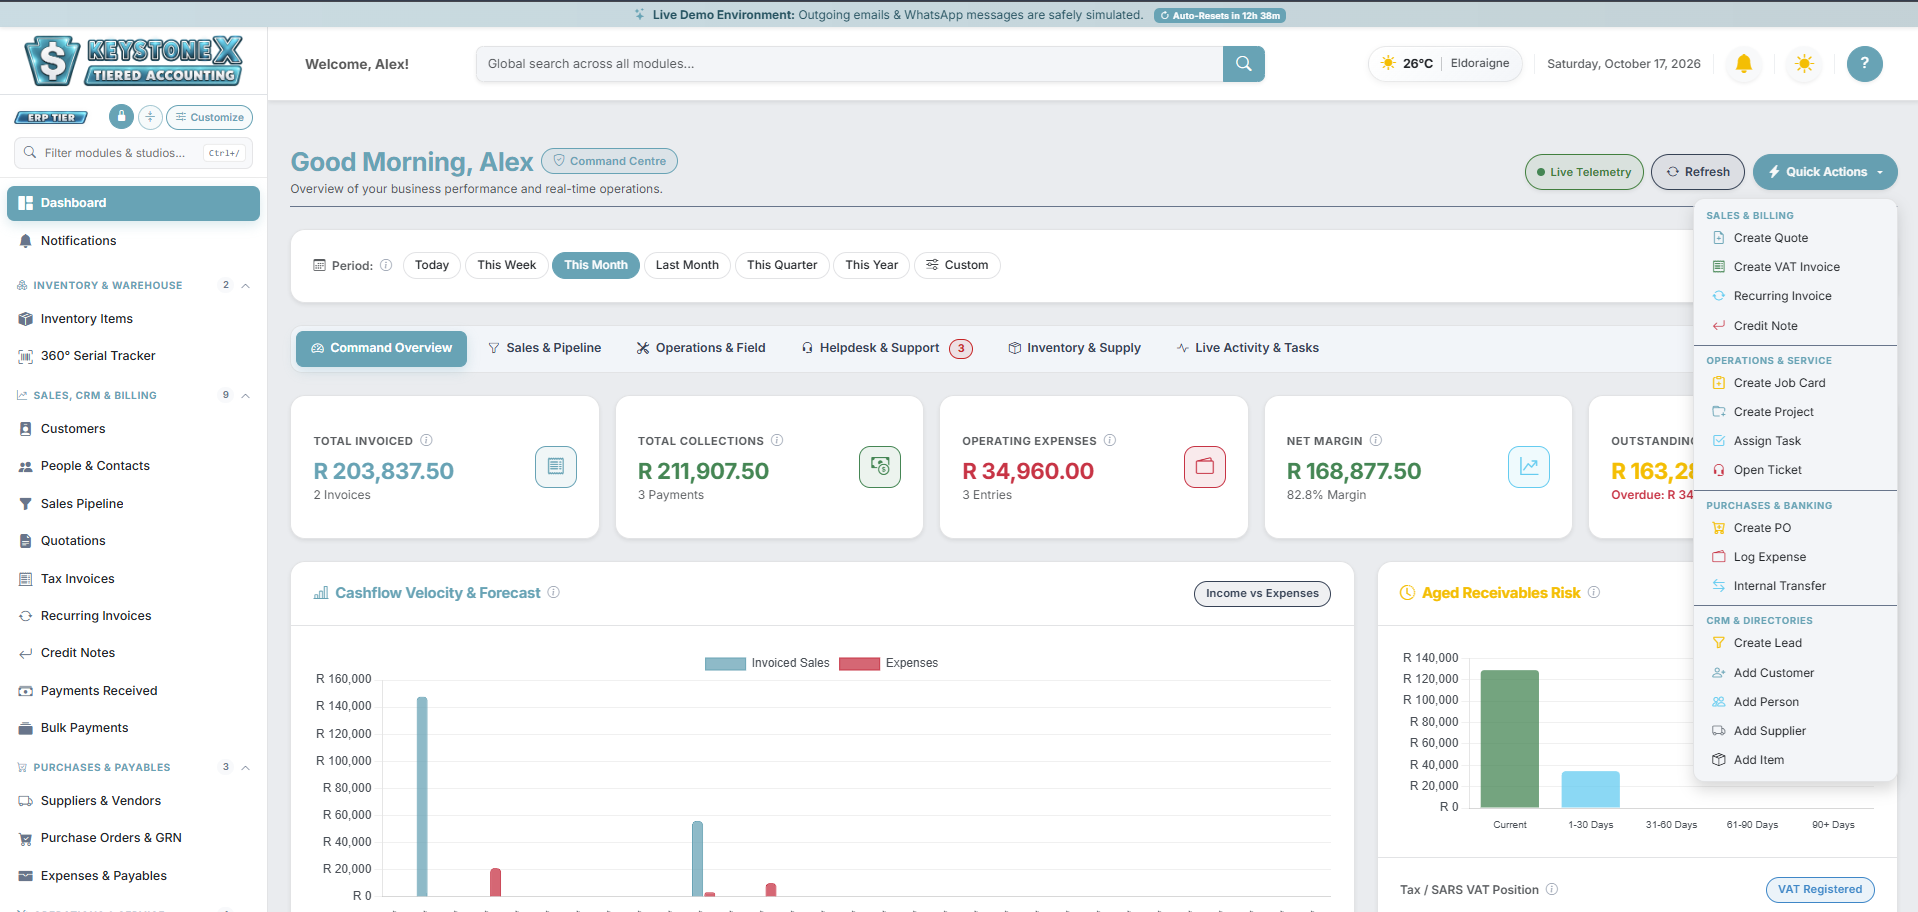
2.1 Top-Right Header Controls
| Button / Badge | What It Means & What Happens When You Click It |
|---|---|
| Live Telemetry | Indicates that your Command Centre is connected to the live asynchronous telemetry engine. Whenever you change the date range or click Refresh, all KPI cards and charts update smoothly without reloading the entire page. |
Refresh Button (#btnCcRefresh) |
Polls the server in the background (`ajaxOverviewStats`, `ajaxSalesCrmStats`, `ajaxOperationsStats`, `ajaxHelpdeskStats`, and `ajaxInventoryStats`) and refreshes every KPI figure and chart on screen using your currently selected date window. |
| Quick Actions Dropdown () | A 1-click launchpad grouped into 4 operational sections (only showing links for modules currently enabled in your license/settings): • Sales & Billing: Create Quote ( /quote/add), Create [VAT] Invoice (/invoice/add), Recurring Invoice (/RecurringInvoice/add), Credit Note (/CreditNote/add). • Operations & Service: Create Job Card ( /jobcard/add), Create Project (/project/add), Assign Task (opens the on-page #quickTaskModal), Open Ticket (/ticket/add). • Purchases & Banking: Create PO ( /PurchaseOrder/add), Log Expense (/expense/add), Internal Transfer (/InternalTransfer/add). • CRM & Directories: Create Lead ( /lead/add), Add Customer (/customer/add), Add Person (/people/add), Add Supplier (/vendor/add), Add Item (/inventory/add). |
2.2 The Asynchronous Date Period Control Bar
Directly below the page header is the Period Filter Bar. Clicking any preset pill immediately recalculates all financial totals, win-rates, and charts for that exact window:
- Preset Pills:
Today,This Week,This Month(Default),Last Month,This Quarter, andThis Year. - Custom Pill: Expands a collapsible bar with From (
#ccCustomStart) and To (#ccCustomEnd) date pickers. Choose your start and end dates and click Apply Range (#btnApplyCustomDate). - Active Date Range Badge (Right): Displays the exact calendar dates currently being analyzed (e.g.,
01 Oct 2026 — 31 Oct 2026).
3. Complete Guide to All 6 Command Centre Tabs
The Command Centre organizes your business telemetry into 6 domain tabs. When you click a tab, Keystone X remembers your active tab in browser storage and updates the URL hash (e.g., #tab-sales)—and if the right-hand Page Help Drawer is open, it automatically switches the help article to match your active tab!
Tab 1: Command Overview (#tab-overview)
Your executive financial summary showing revenue, cash collections, expenditure, profitability, debtor risk, and SARS VAT position.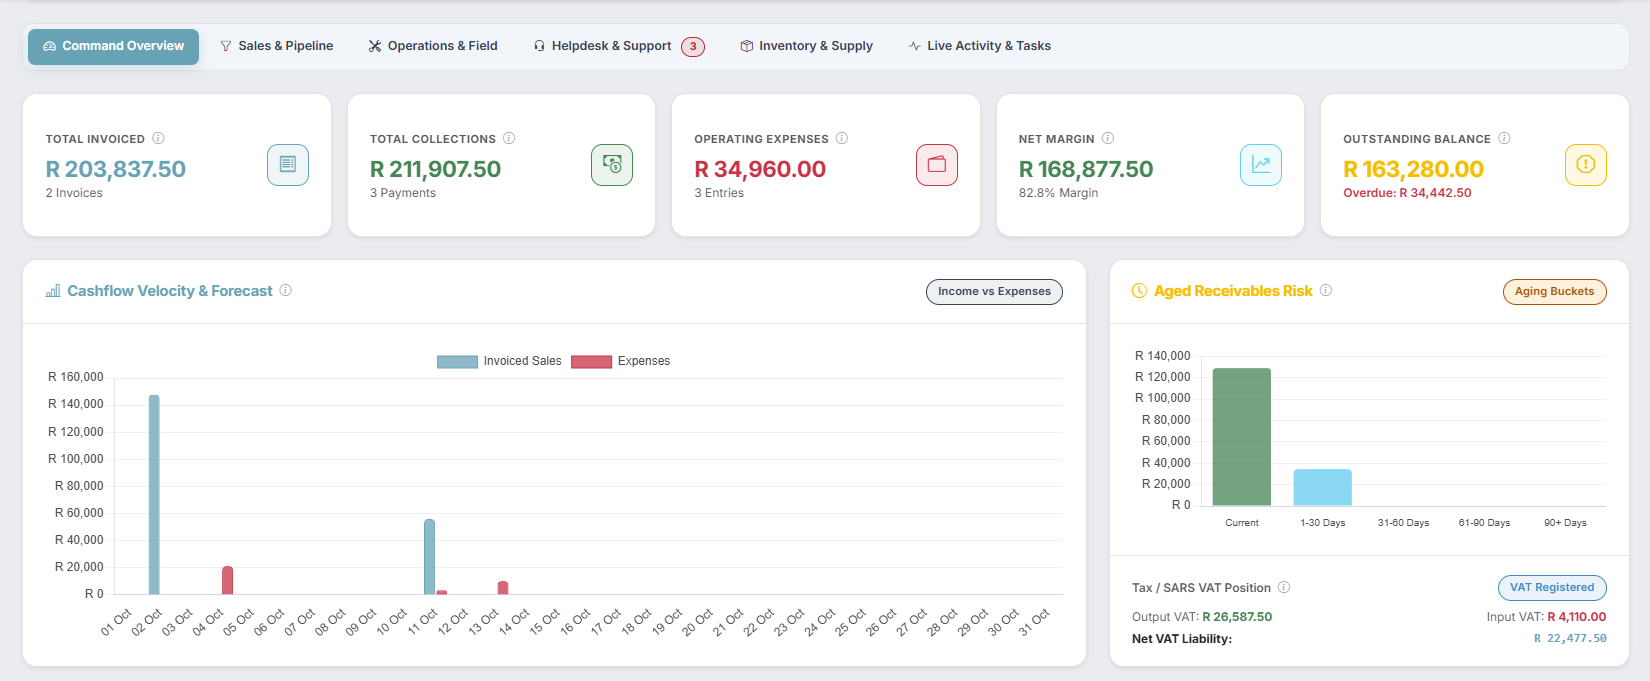
| KPI Card / Widget | Plain-English Accounting Meaning | How It Is Calculated & Interactive Elements |
|---|---|---|
| 1. Total Invoiced (Blue) | How much you billed customers during the selected period (Accrual Revenue). | Sum of total on all non-cancelled, non-draft Tax Invoices dated within the selected range, plus total count of invoices issued. |
| 2. Total Collections (Green) | Actual cash received in your bank accounts from customer payments during the period. | Sum of all recorded customer payments (payments.amount) dated within the selected period, plus count of payment transactions. |
| 3. Operating Expenses (Red) | Money spent on business overheads and supplier bills during the period. | Sum of total_amount from all logged Expenses within the selected period, plus count of expense entries. |
| 4. Net Margin (Green/Red) | Your operating profit (or loss) for the selected period. | Calculated as Total Invoiced − Operating Expenses. Displays the rand value (green if positive, red if negative) and the percentage profit margin (Net Profit ÷ Total Invoiced × 100). |
| 5. Outstanding Balance (Yellow/Red) | Total unpaid money customers currently owe you (Accounts Receivable). | Shows total unpaid balance across all open invoices, with a red sub-label showing how much of that total is Overdue (past its payment due date). |
| Chart: Cashflow Velocity & Forecast | Side-by-side bar chart comparing Invoiced Sales (Teal) vs. Expenses (Red) over time. | Automatically groups bars by day if your selected date range is 45 days or shorter, or by month for longer periods. Hover over any bar to inspect exact currency totals. |
| Chart: Aged Receivables Risk | Bar chart breaking down unpaid customer debt by how old it is. | Groups unpaid invoice balances into Current (<30d), 30–60d, 60–90d, and 90+ days so you can spot slow-paying debtors before they become bad debt. |
| Widget: Tax / SARS VAT Position | Live snapshot of your VAT tax liability for the selected period. | Displays a VAT Registered or Non-VAT badge. When VAT Registered, shows: • Output VAT (Green): VAT charged on sales invoices. • Input VAT (Red): VAT claimed back on expenses. • Net VAT Liability: Output VAT − Input VAT. |
| Tables: Recent Invoices & Recent Quotes | Quick lists of the latest invoices and quotes issued in the period. | Click any Invoice # or Quote # to open it directly, or click View All in the card header to open the full register. Status badges are color-coded (Draft = Grey, Sent = Blue, Partially paid = Cyan, Paid in full / Approved = Green, Overdue / Declined = Red). |
Tab 2: Sales & Pipeline (#tab-sales)
Tracks CRM lead qualification, quotation win-rates, top-spending clients, and best-selling catalog items.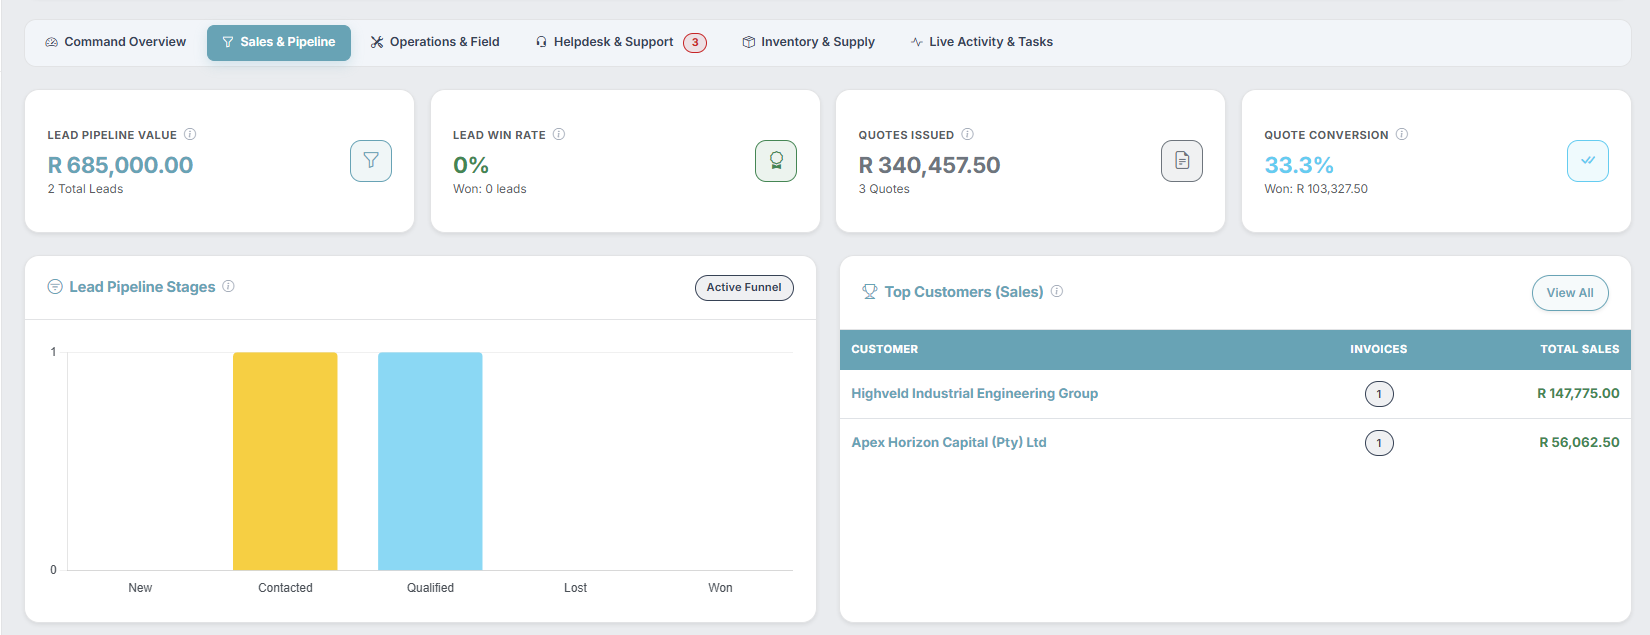
- KPI 1 — Lead Pipeline Value: Total estimated deal value (
R) and count of leads created in the selected period. - KPI 2 — Lead Win Rate: Percentage (
%) of leads converted toWonstatus out of total leads in the period. - KPI 3 — Quotes Issued: Total monetary value (
R) and count of quotations generated in the period. - KPI 4 — Quote Conversion: Percentage (
%) and cumulative value (R) of quotes markedApprovedorInvoiced. - Chart — Lead Pipeline Funnel (
#salesLeadStagesChart): Visual bar chart showing the number of leads sitting in each pipeline stage (e.g., New, Contacted, Qualified, Proposal Sent, Won, Lost). - Leaderboard — Top Customers by Revenue: Ranks your top 5 customers by invoiced sales volume, showing invoice count and total spend. Click any customer name to open their 360° Customer Profile.
- Leaderboard — Top Products / Services: Ranks your highest-performing inventory items or services by units sold (
Qty) and total billed revenue. - Table — Recent Leads & Prospects: Lists your newest sales leads with their estimated value and current stage badge.
Tab 3: Operations & Field (#tab-operations)
Monitors workshop job cards, field service technician dispatches, multi-milestone client projects, and billable labor hours.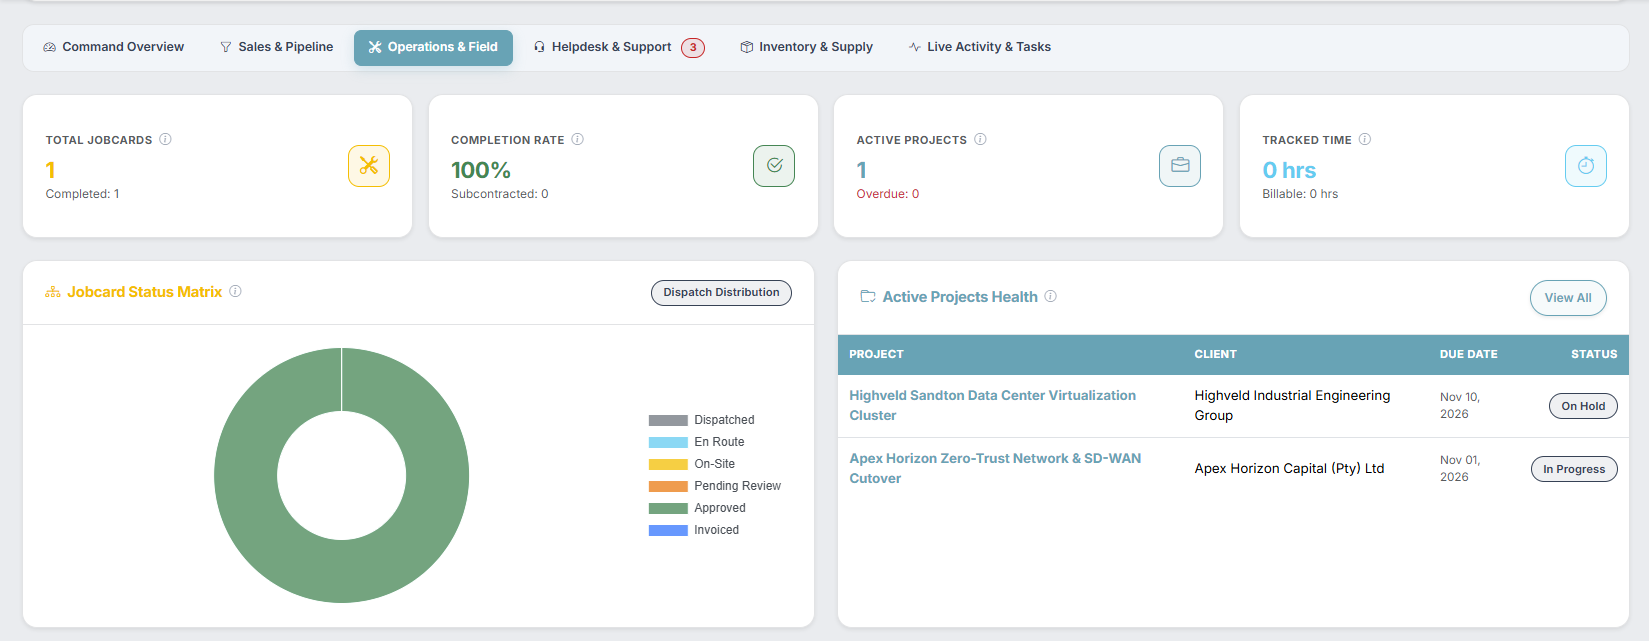
- KPI 1 — Total Jobcards: Total job cards created in the period, with a sub-counter for
Completedjobs. - KPI 2 — Completion Rate: Percentage (
%) of job cards finished/invoiced, plus count ofSubcontractedjobs. - KPI 3 — Active Projects: Number of ongoing projects, highlighting any
Overdueprojects in red. - KPI 4 — Tracked Time: Total labor hours (
hrs) logged across projects and job cards, plusBillablehours. - Chart — Jobcard Status Matrix (
#opsJobcardStatusChart): Doughnut chart breaking down work orders by status (Scheduled, In Progress, Awaiting Parts, Completed, Invoiced). - Table — Active Projects Health: Shows Project Title (clickable), Client Name (or
Internal), Due Date, and Status badge. - Table — Recent Field Jobcards: Shows Jobcard #, Customer, Assigned Technician, Scheduled Date/Time, and Status badge.
Tab 4: Helpdesk & Support (#tab-support)
Monitors customer support ticket volume, urgent SLA escalations, and resolution turnaround. Note that if there are unresolved Urgent tickets, a red counter badge (#badgeSupportUrgent) pulses directly on the tab button itself.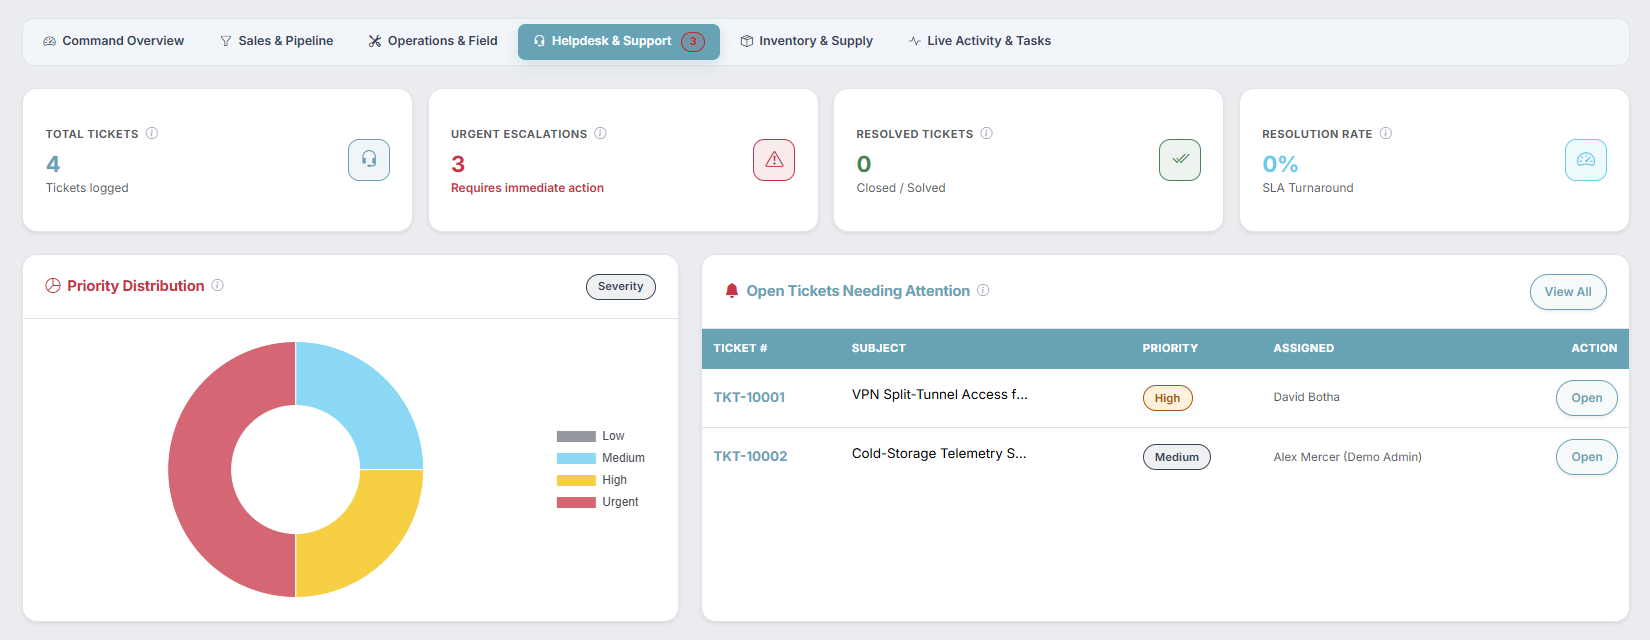
- KPI 1 — Total Tickets: Total support tickets opened during the selected period.
- KPI 2 — Urgent Escalations: Unresolved tickets flagged as
Urgentrequiring immediate intervention. - KPI 3 — Resolved Tickets: Number of tickets marked
ResolvedorClosedin the period. - KPI 4 — Resolution Rate: SLA turnaround percentage (
Resolved ÷ Total Tickets × 100). - Chart — Priority Distribution (
#supportPriorityChart): Doughnut chart comparingLow,Medium,High, andUrgentticket counts. - Table — Open Tickets Needing Attention: Lists unresolved tickets sorted by urgency, showing Ticket #, Subject, Priority badge, Assigned Agent, and a 1-click Open button (
/ticket/viewTicket/{id}).
Tab 5: Inventory & Supply (#tab-inventory)
Tracks warehouse asset valuation, retail revenue potential, critical stock depletion alerts (indicated by a yellow badge #badgeInventoryLow on the tab button), and supplier procurement spend.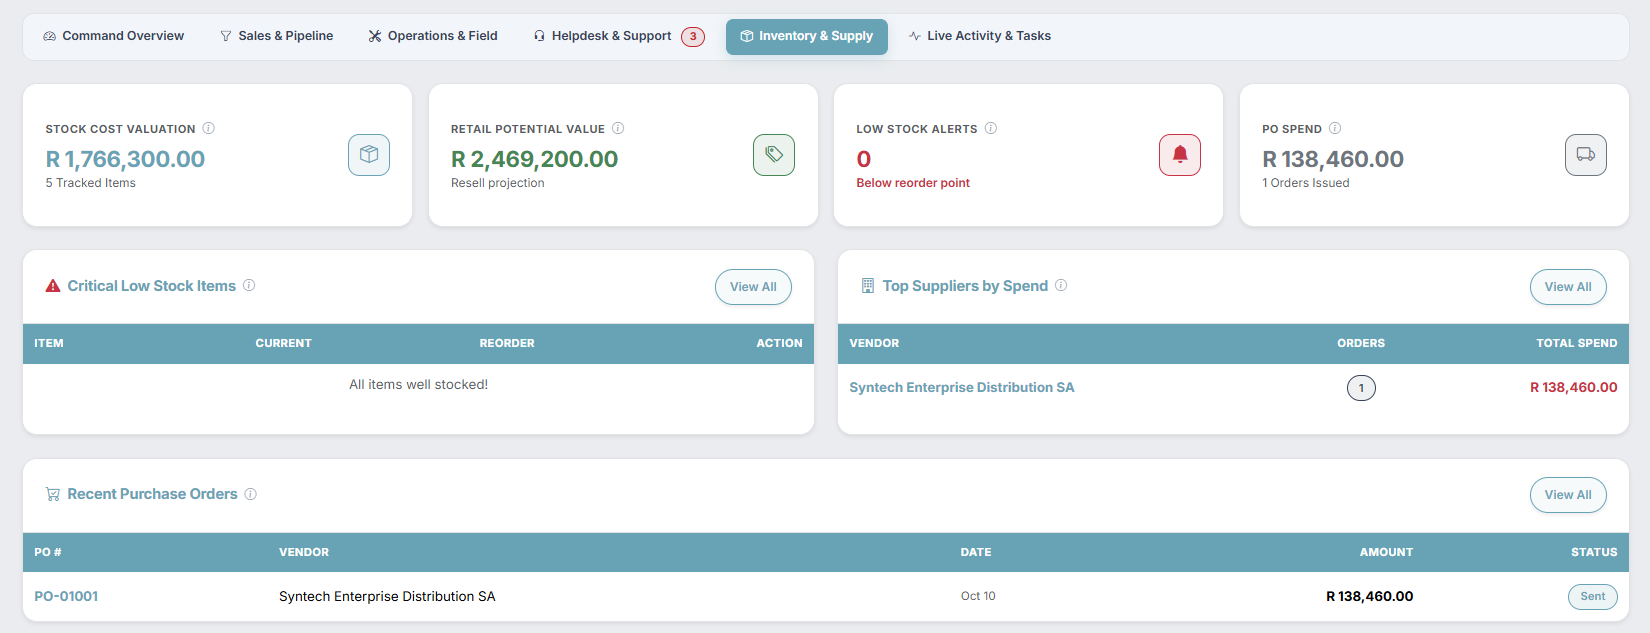
- KPI 1 — Stock Cost Valuation: Total balance-sheet asset value of physical stock on hand (
Stock Quantity × Unit Cost Price) and count of tracked SKUs. - KPI 2 — Retail Potential Value: Projected gross sales revenue if all current stock on hand is sold at retail list price.
- KPI 3 — Low Stock Alerts: Count of items where current warehouse stock has fallen at or below its configured
Reorder Level. - KPI 4 — PO Spend: Total value and count of Purchase Orders issued to suppliers during the selected period.
- Table — Critical Low Stock Items: Lists depleted items showing Item Name & SKU, Current Qty (red badge), Reorder Level, and a 1-click Order button that jumps straight to
/PurchaseOrder/add(or Edit if Purchase Orders are disabled). - Table — Top Suppliers by Spend: Ranks your top vendors by PO count and total procurement spend.
- Table — Recent Purchase Orders: Lists latest supplier POs with PO #, Vendor, Date, Amount, and Status badge (
Draft,Sent,Received,Cancelled).
Tab 6: Live Activity & Tasks (#tab-activity)
Combines internal team task deadline tracking (with a red overdue counter badge #badgeActivityOverdue on the tab) and a live chronological stream of the Forensic Audit Log.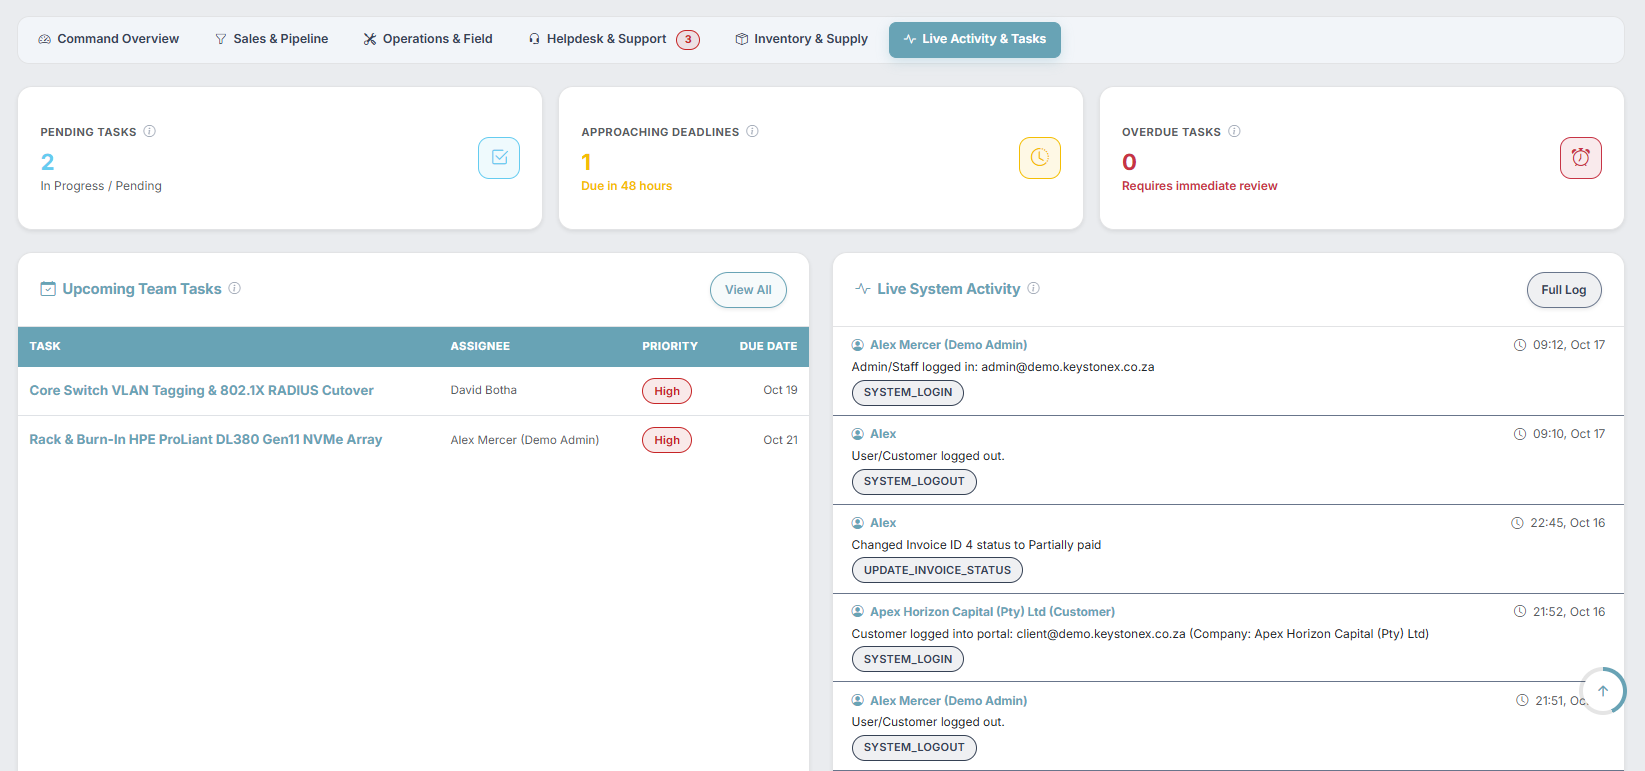
- KPI 1 — Pending Tasks: Total active tasks currently in
PendingorIn Progressstatus. - KPI 2 — Approaching Deadlines: Tasks with due dates arriving within the next 48 hours.
- KPI 3 — Overdue Tasks: Unfinished tasks whose due date has already passed.
- Table — Upcoming Team Tasks: Shows Task Title (clickable to
/task/details/{id}), Assignee, Priority badge, and Due Date. - Stream — Live System Activity: Displays the most recent user actions recorded across the entire ERP (showing Operator Name, Timestamp, Action Description, and Event Type badge), with a Full Log button linking to
/AuditLog/index.
4. The Dashboard "Assign Task" Quick Modal (#quickTaskModal)
Clicking Quick Actions → Assign Task opens an instant task creation modal without leaving the Dashboard:
| Modal Field / Button | Type / Required | Description |
|---|---|---|
Task Title * (name="title") |
Text (Required) | Short summary of the action item (e.g., Follow up on signed lease agreement). |
Priority Level (name="priority") |
Dropdown | Select Low Priority, Medium Priority (default), or High Priority. |
Due Date * (name="due_date") |
Date (Required) | Defaults to today's date. Controls when 48-hour approaching and overdue notifications fire. |
Description / Context (name="description") |
Textarea (Optional) | Detailed notes or instructions for the task. |
| Create Task Button | Submit Button | Posts to /task/add (with source=dashboard) and adds the task immediately to the Task Board. |
5. Secure Field Technician Workspace Mode
When a staff member whose role does not include view_reports logs in, `/home/index` automatically renders the Field Technician Workspace:
- 3 Personal KPI Cards: Assigned Jobcards (count of jobs assigned to this user), Open Tickets (support tickets assigned to this user), and Pending Tasks (internal tasks assigned to this user).
- My Assigned Jobcards Table: Lists up to 5 upcoming assigned jobs. Clicking the Jobcard # opens the specialized Mobile Field Execution View (
/jobcard/mobile/{id}) designed for smartphones and tablets on-site (with digital customer signature pad). - My Open Tickets Table: Lists up to 5 assigned support tickets with direct links to
/ticket/viewTicket/{id}. - My Pending Tasks Table: Lists up to 5 personal tasks ordered by due date.